What do you do when you need midrange speakers capable of keeping up with a pair of 15-inch Power Series subwoofers in the back of your SUV? The answer is the Rockford Fosgate PPS4-10 Punch Pro 10-inch speaker. These beasts boast a subwoofer-sized voice coil and handle 350 watts of power to ensure every word remains clear and audible over all that bass. Let’s dive into the details!
Rockford Fosgate Punch Pro PPS4-10 Features
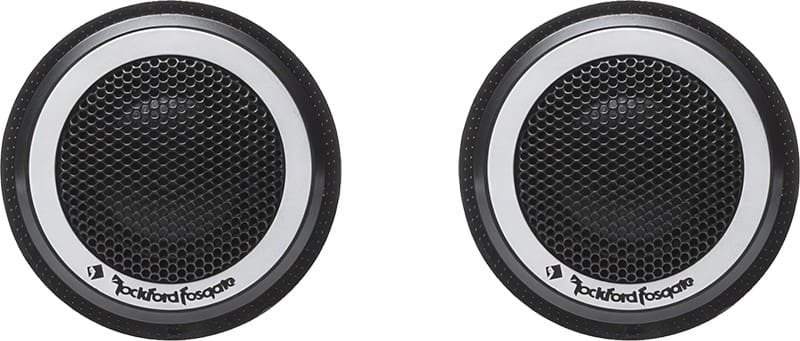
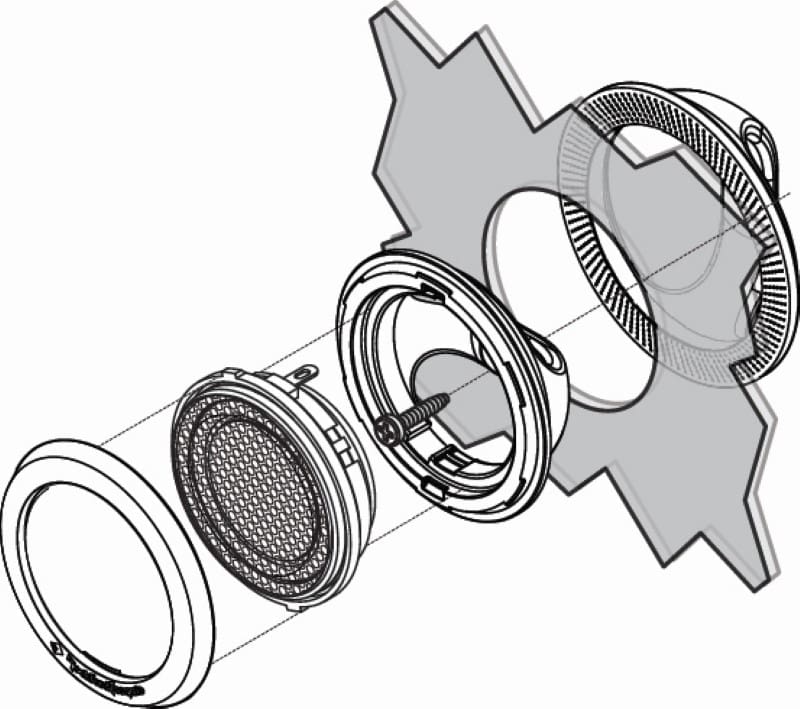
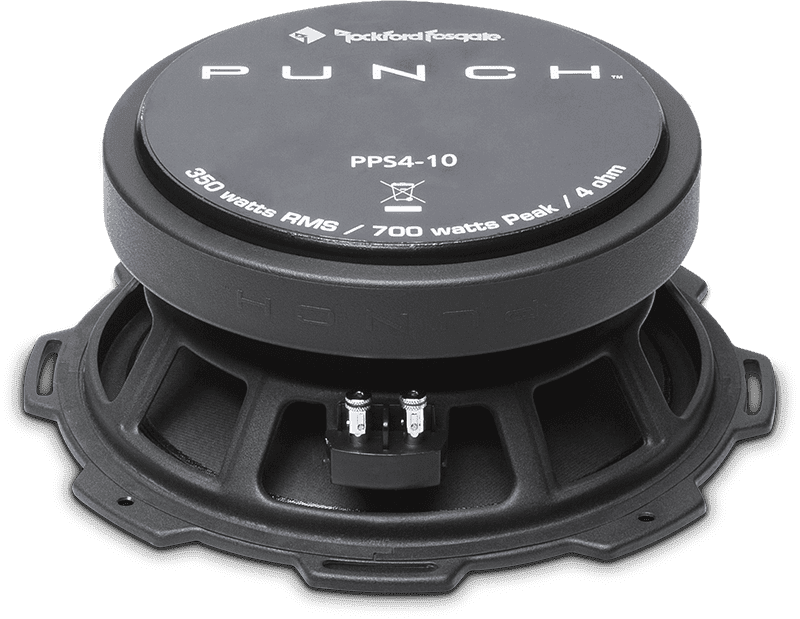
The PPS4-10 is a high-efficiency midrange speaker with a massive 10-inch size. Sold individually, these speakers achieve an impressive efficiency of 96 dB SPL with just one watt of power measured at one meter. Each speaker includes a sturdy mesh grille for added protection in indoor installations.
Built on a stamped steel chassis, the PPS4-10 features a large 8.25 by 1-inch ceramic magnet. The basket uses the StampCast design, which provides the structural rigidity and provides the sleek look of a cast-aluminum design. Additionally, the mounting flange includes four slotted holes, allowing precise alignment during installation. Despite its large diameter, the speaker requires only 4.06 inches of mounting depth.
Punch Pro Midrange Soft Parts
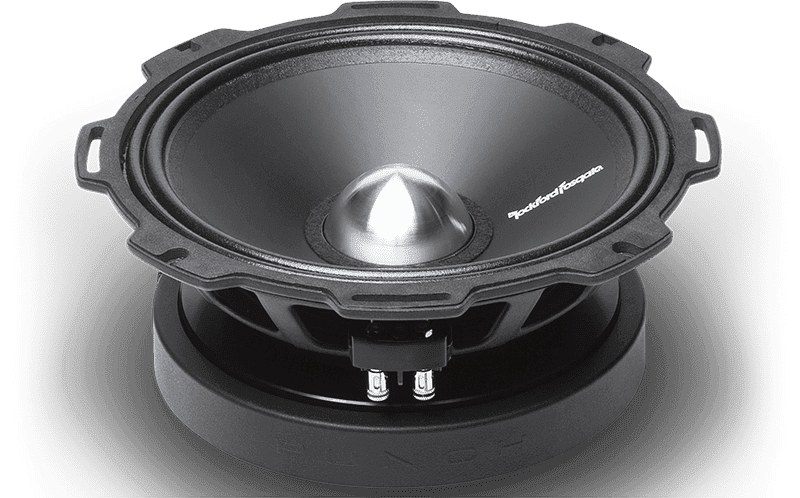
The speaker’s cone is made from fiber-reinforced pressed paper, keeping the cone mass low to help the speaker’s efficiency. A treated textile W-shaped surround connects the cone to the basket, while a high-temperature 2.58-inch aluminum voice coil sits at the core, topped by a machined aluminum phase plug. Beneath the cone, a poly-cotton spider delivers excellent control and durability.
For electrical connections, the PPS4-10 uses spring-loaded terminals mounted on the basket. Fatigue-resistant tinsel leads, sewn to the spider, prevent noise at high power levels.
PPS4-10 Specifications and Application
The PPS4-10 has a resonant frequency (Fs) of 53.5 Hz, an equivalent compliance (Vas) of 1.24 cubic feet, and a total Q (Qts) of 0.26. With a maximum one-way excursion (Xmax) of 4.6 mm, it offers impressive performance for a midrange speaker.
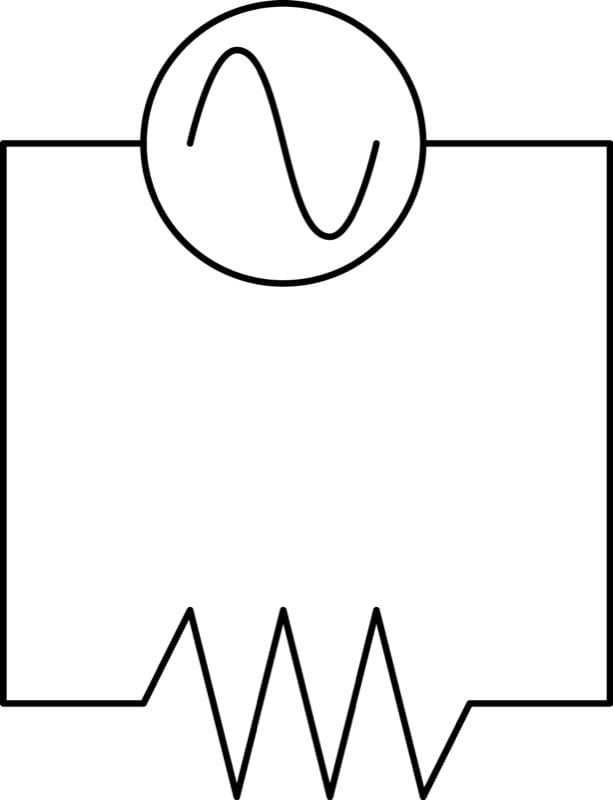
To explore potential applications, we conducted simulations based on an estimated effective cone area for the PPS4-10. In infinite baffle setups, the mids perform with a -3 dB frequency of around 200 Hz.
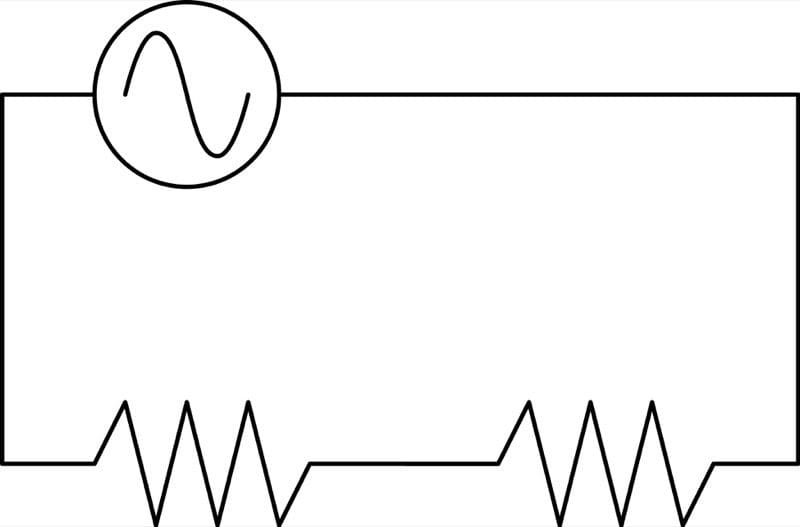
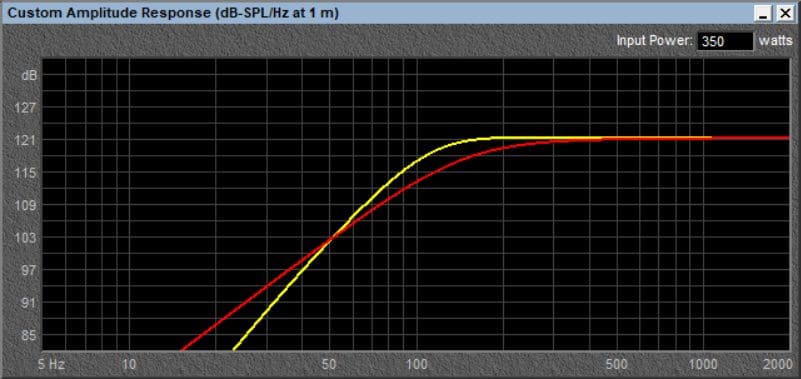
Each speaker requires a minimum of 0.2 cubic feet of airspace for sealed enclosures. This setup delivers a -3 dB frequency just above 160 Hz. To bridge the frequency gap between these mids and a subwoofer, consider a woofer like the Prime R2 or Punch P1, which can comfortably play up to 150 Hz.
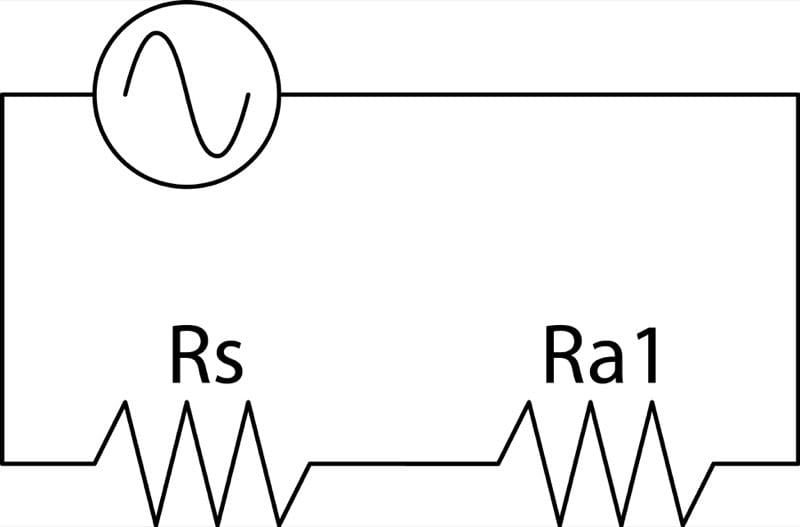
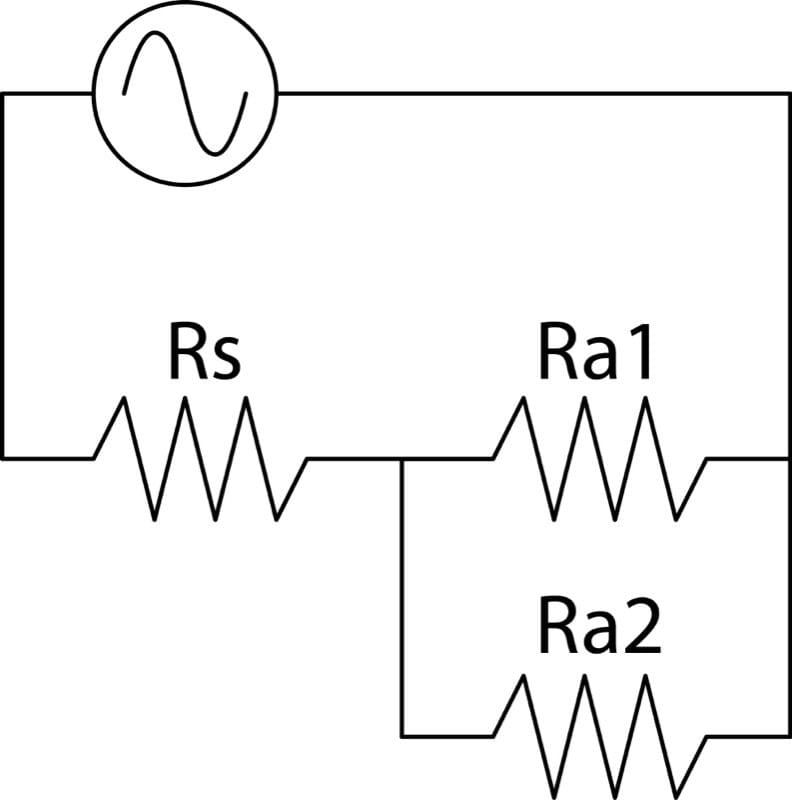
If you need the mids to handle lower frequencies, your installer can build a vented enclosure with a net volume of 0.25 cubic feet with a vent tuning frequency of 80 Hz. This configuration extends the output to just under 100 Hz. Unless you run massive, heavy subwoofers, you should be able to use a high-pass crossover at 100 Hz and still have the system sound dynamic and punchy.
Rock Out with the Rockford Fosgate Punch Pro Mids!
If you need midrange speakers to keep up with a wall of subwoofers, the Punch Pro series, including the PPS4-10, is an excellent choice. The Punch Pro lineup also features 6.5-inch and 8-inch mids to accommodate different installation spaces. All three sizes are available in four-ohm configurations.
You can find a dealer near you using the locator tool on their website. Be sure to follow our friends from Tempe on Facebook, Instagram and YouTube to keep up with new product releases and the events they attend.
This article is written and produced by the team at www.BestCarAudio.com. Reproduction or use of any kind is prohibited without the express written permission of 1sixty8 media.